The SAGE community is pleased to announce that a special collection is now open in the following AGU journals: Journal of Geophysical Research: Atmospheres, Earth and Space Science, and Geophysical Research Letters.
The call for papers is available at this link, where you may also submit your manuscripts to the special collection. In addition, if you or your team have published relevant papers in recent years and would like them to be included in the collection, please let us know.
Studies have shown that articles published in special collections generally receive greater visibility, citations, and overall impact than they otherwise would. Collectively, your contributions will help the SAGE mission reach a broader AGU community by highlighting its unique and robust nearly half-century record of atmospheric composition profiling measurements in the upper troposphere and stratosphere (UTS), as well as its continuing capability to enable new scientific discoveries and advances in modeling and prediction for the UTS and the Earth system.
The upper troposphere and stratosphere (UTS) are vital to global climate change and societal well-being. Hosting the ozone layer that protects life on Earth from exposure to harmful UV radiation, the UTS is influenced by intricate interactions between chemistry, dynamics, and radiation.
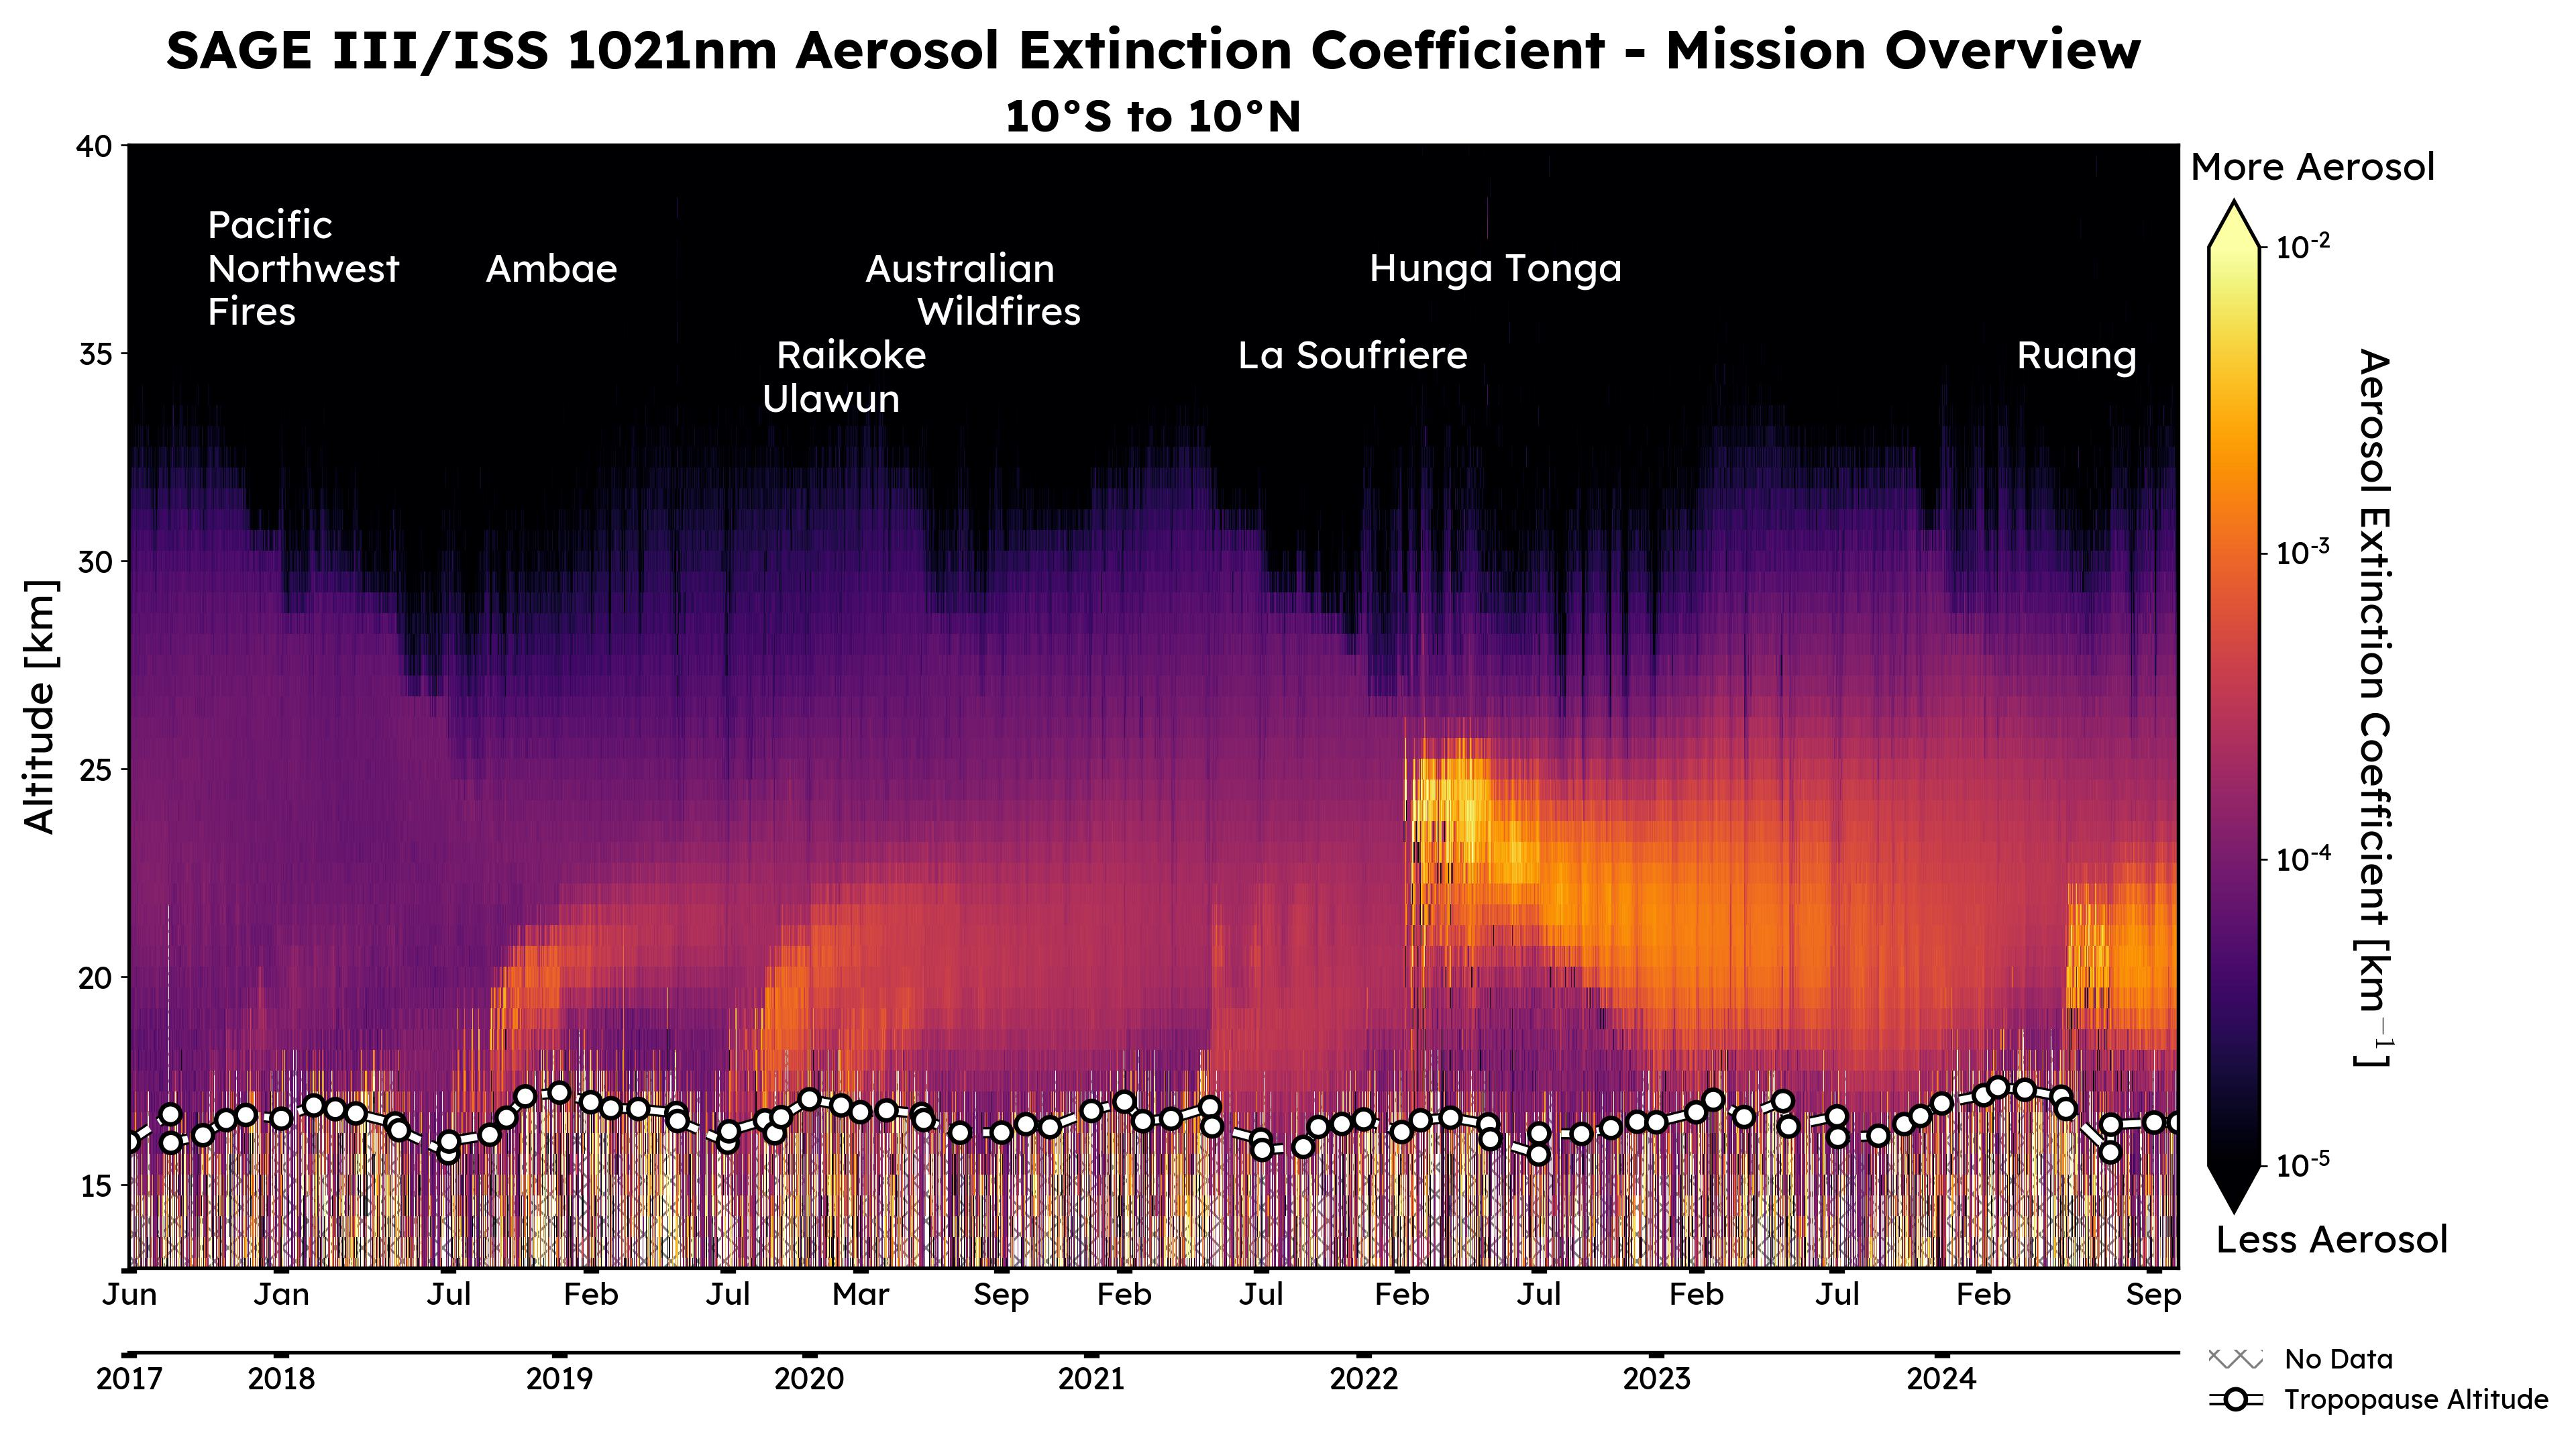
This special collection of articles leverages data products from the Stratospheric Aerosol and Gas Experiment (SAGE) satellite missions, initiated in the late 1970s, to investigate changes in atmospheric composition (e.g., ozone, aerosols, clouds, water vapor, nitrogen dioxide, and other trace gases) and their climate impacts. A central focus is the application of SAGE III data collected aboard the International Space Station (ISS) since 2017 to improve understanding and modeling of UTS processes, such as transport and aging of emitted gases from volcanic eruptions, fire-driven injections (e.g., pyrocumulonimbus events), and stratosphere-troposphere exchanges. Submissions are invited in the following areas: (a) development, calibration, and validation of SAGE data products; (b) integration with other satellite data for long-term UTS composition records, including but not limited to using SAGE datasets from SAGE I (1978–1981), SAGE II (1984–2005), and SAGE III on Meteor-3M (2001 2006); (c) modeling and analysis to advance understanding and prediction of UTS processes and climate feedbacks; and (d) innovations in SAGE data products and satellite instruments for improved monitoring of UTS. By building on SAGE’s extensive data record, this collection seeks to critically review the past findings, summarize current progresses, and shape future research on the UTS and its critical role in Earth’s climate system.
Topics for this call for papers include but are not restricted to:
- volcanic aerosols and radiative forcing
- pyrocumulonimbus fires
- ozone layer recovery and processes
- water vapor feedback
- vertical profiles of water vapor, aerosols, and clouds in upper troposphere and stratosphere
- Hunga volcanic eruption
- occultation and limb remote sensing techniques
- stratosphere and troposphere exchange
- heterogeneous chemistry in UTS
We warmly invite you to contribute and help make this SAGE special collection a success. Please share this opportunity with your colleagues and team members and extend our invitation to submit to the collection.
https://agupubs.onlinelibrary.wiley.com/hub/journal/23335084/call-for-papers/si-2025-001624
Special Collection Organizers:
Jun Wang
The University of Iowa
David Flittner
NASA
Emma Knowland
NASA
Richard Eckman
University of Maryland – College Park
Xi Chen
The University of Iowa


")


