The first set of lunar data collected from the Stratospheric Aerosol and Gas Experiment III (SAGE III), a NASA instrument that launched to the International Space Station (ISS) in February 2017, is now available for public use. The data is available through the Atmospheric Science Data Center and includes measurements of ozone and nitrogen trioxide. The initial release of SAGE III/ISS data in October 2017 focused only on solar data collected. The SAGE III/ISS instrument is used to study profiles of aerosols and gases, for example ozone, which is a gas found in the upper atmosphere that acts as Earth’s sunscreen.
Since the SAGE III/ISS instrument collects lunar observations after the sun has set, it is able to record a picture of the atmosphere in the absence of sunlight. For example, nitrogen trioxide (NO3) virtually disappears from the atmosphere when the sun rises, but SAGE III/ISS can utilize lunar occultation to measure its concentration. The instrument collects these occultation measurements by scanning the moon when it rises and sets.
“Essentially, the lunar occultation observations allow the instrument to measure the atmosphere at night in contrast to the solar occultations that occur in daylight,” said SAGE III Project Scientist David Flittner. “The SAGE III/ISS lunar observations extend our measurements to locations and times not covered by the solar observations, augmenting the coverage.”
This nighttime atmospheric species, NO3, is produced by the combination of nitrogen dioxide (NO2) and ozone (O3). In the middle and upper stratosphere, the nighttime loss of NO3 is minimal and the gas acts as a simple indicator of elapsed time since the most recent sunset. The amount of NO3 observed varies strongly with temperature, meaning warmer temperatures typically result in more NO3.
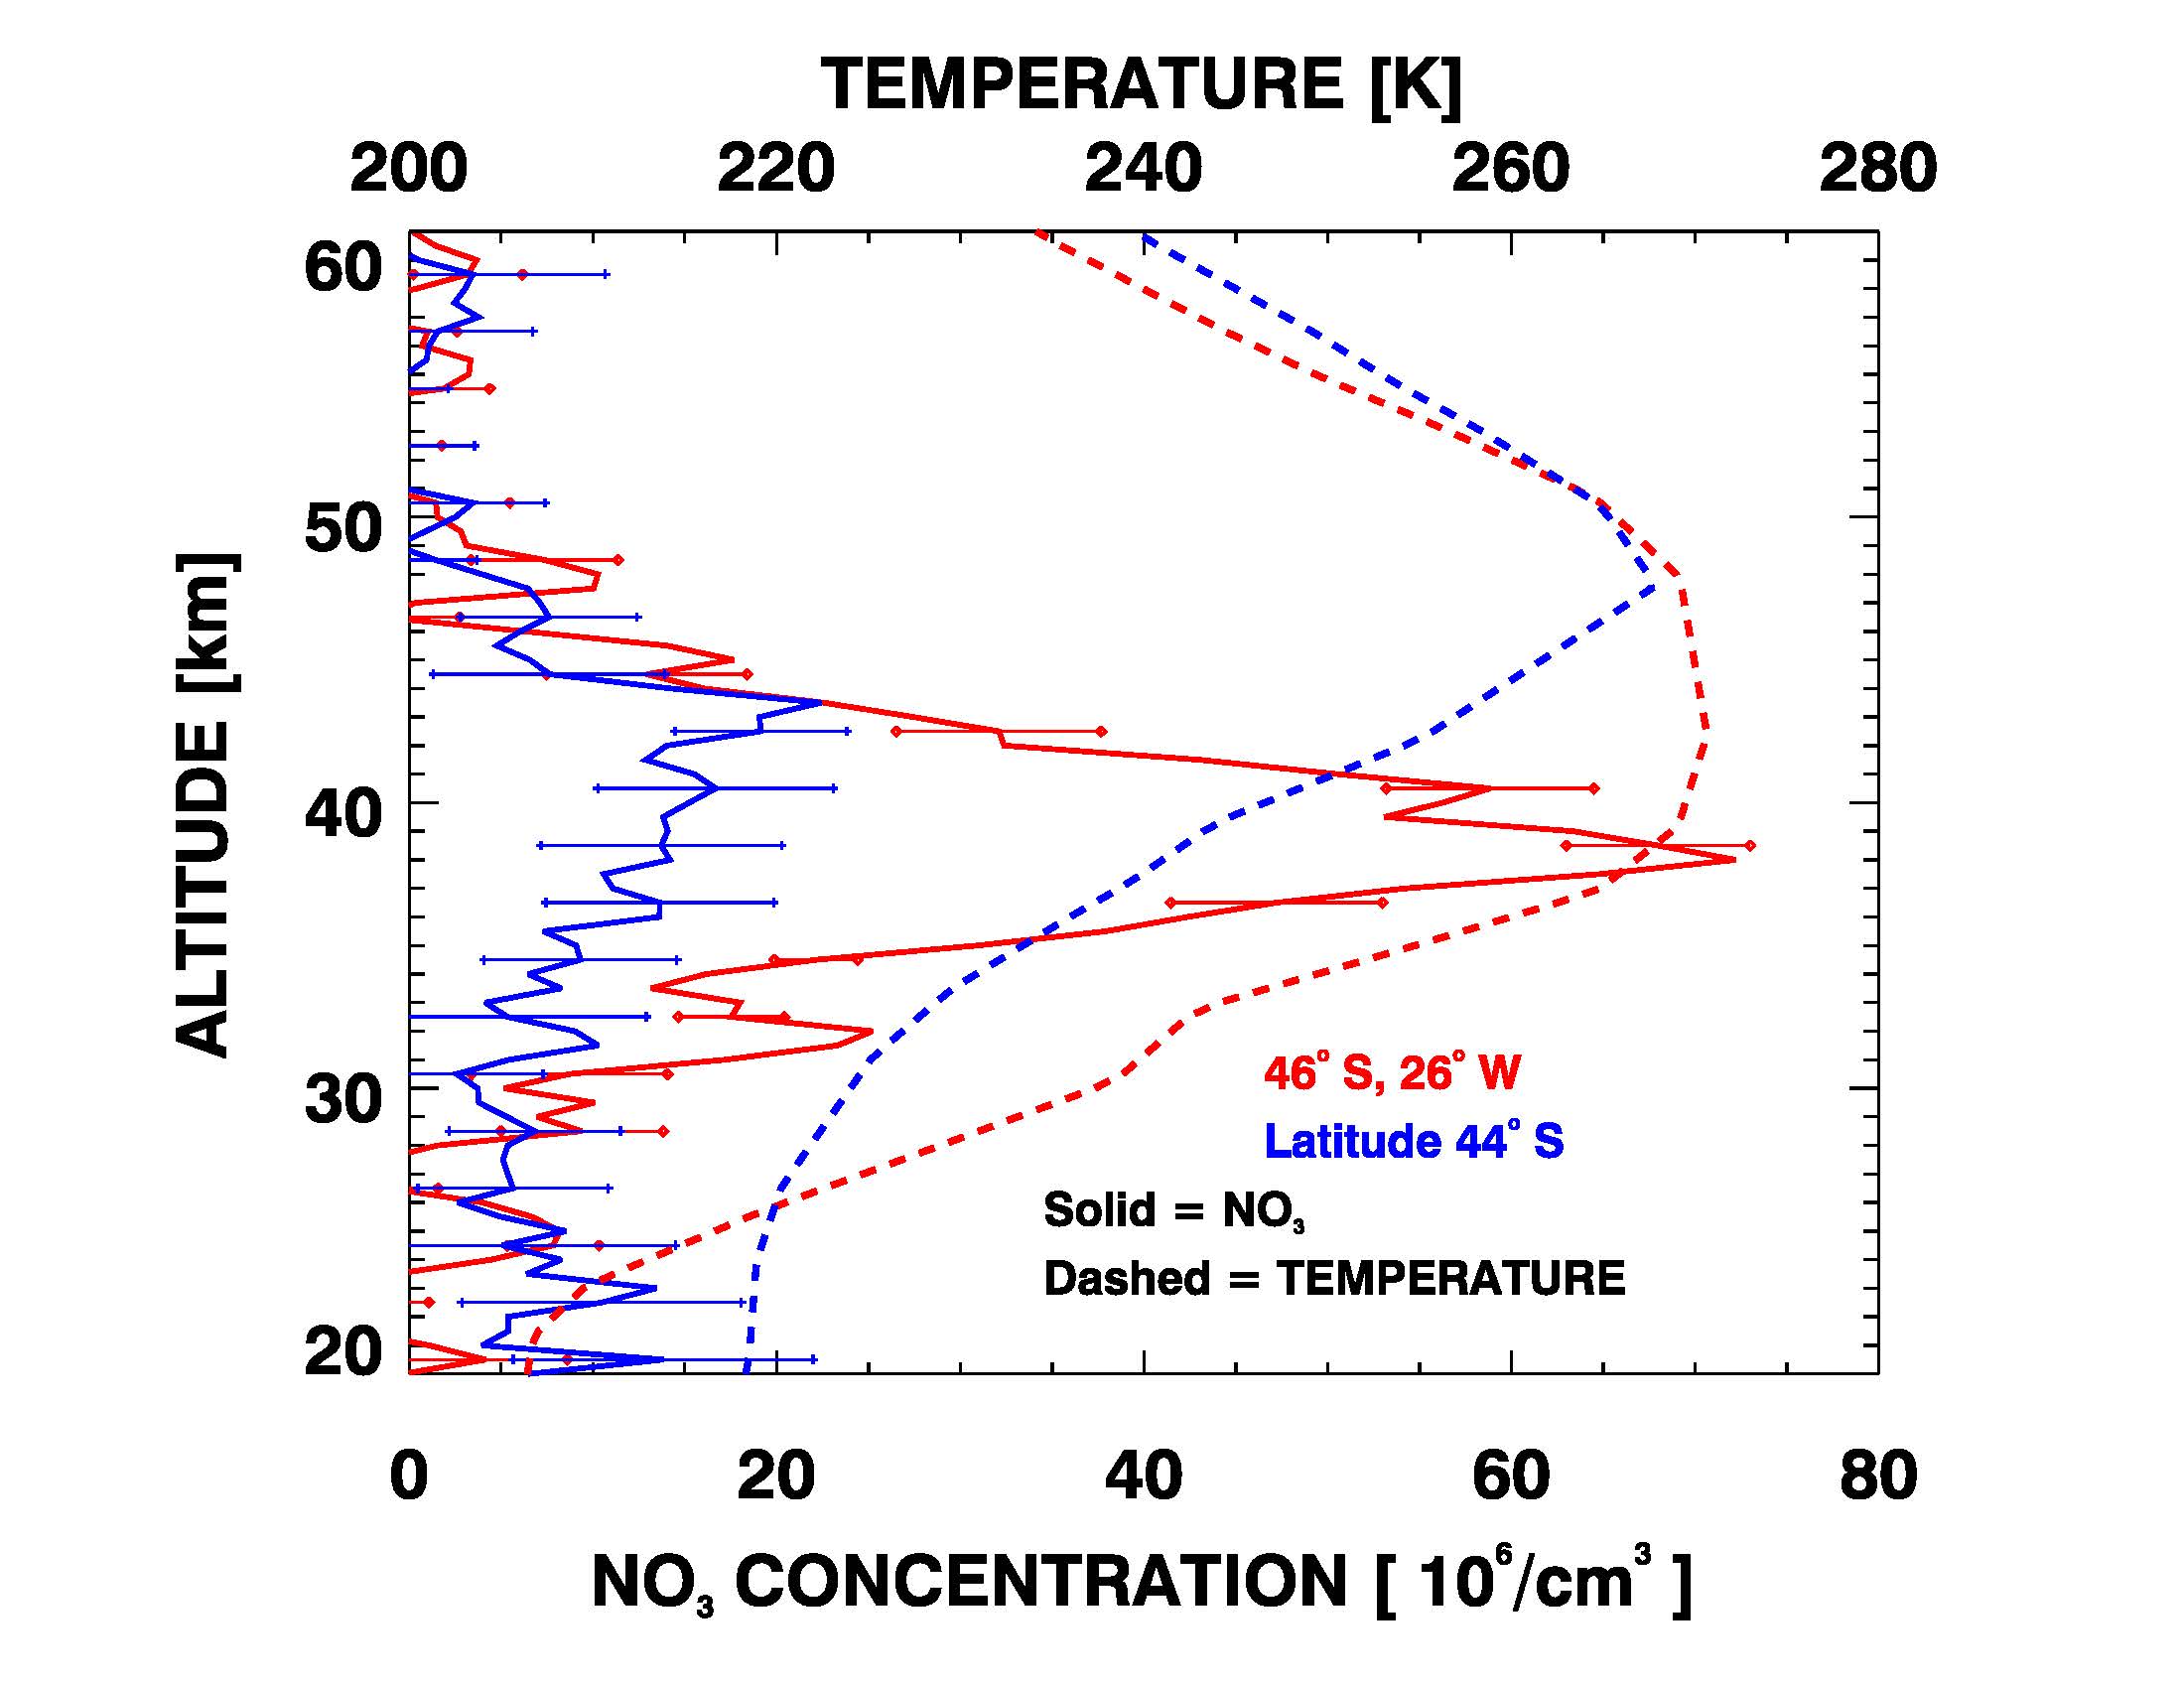
The figure below shows a single NO3 profile (red solid curve) measured by SAGE III/ISS on October 27, 2017 at southern mid-latitudes. This is compared with NO3 measurements from nearby orbits (blue solid curve). The horizontal bars represent the range of variability of each NO3 measurement. Also plotted are the associated Modern-Era Retrospective Analysis for Research and Applications, Version 2 (MERRA-2) temperature profiles (dashed). Based on the lunar occultation measurements made by the instrument, the very high NO3 concentrations correspond to unusually warm temperatures. Even minor peaks in the NO3 concentration in the 31-32 km altitude range correlate with warmer temperatures.
While not included initially, later releases will include solar occultation measurements of water vapor data and lunar occultation measurements of nitrogen dioxide. Future data releases will follow a monthly release schedule.