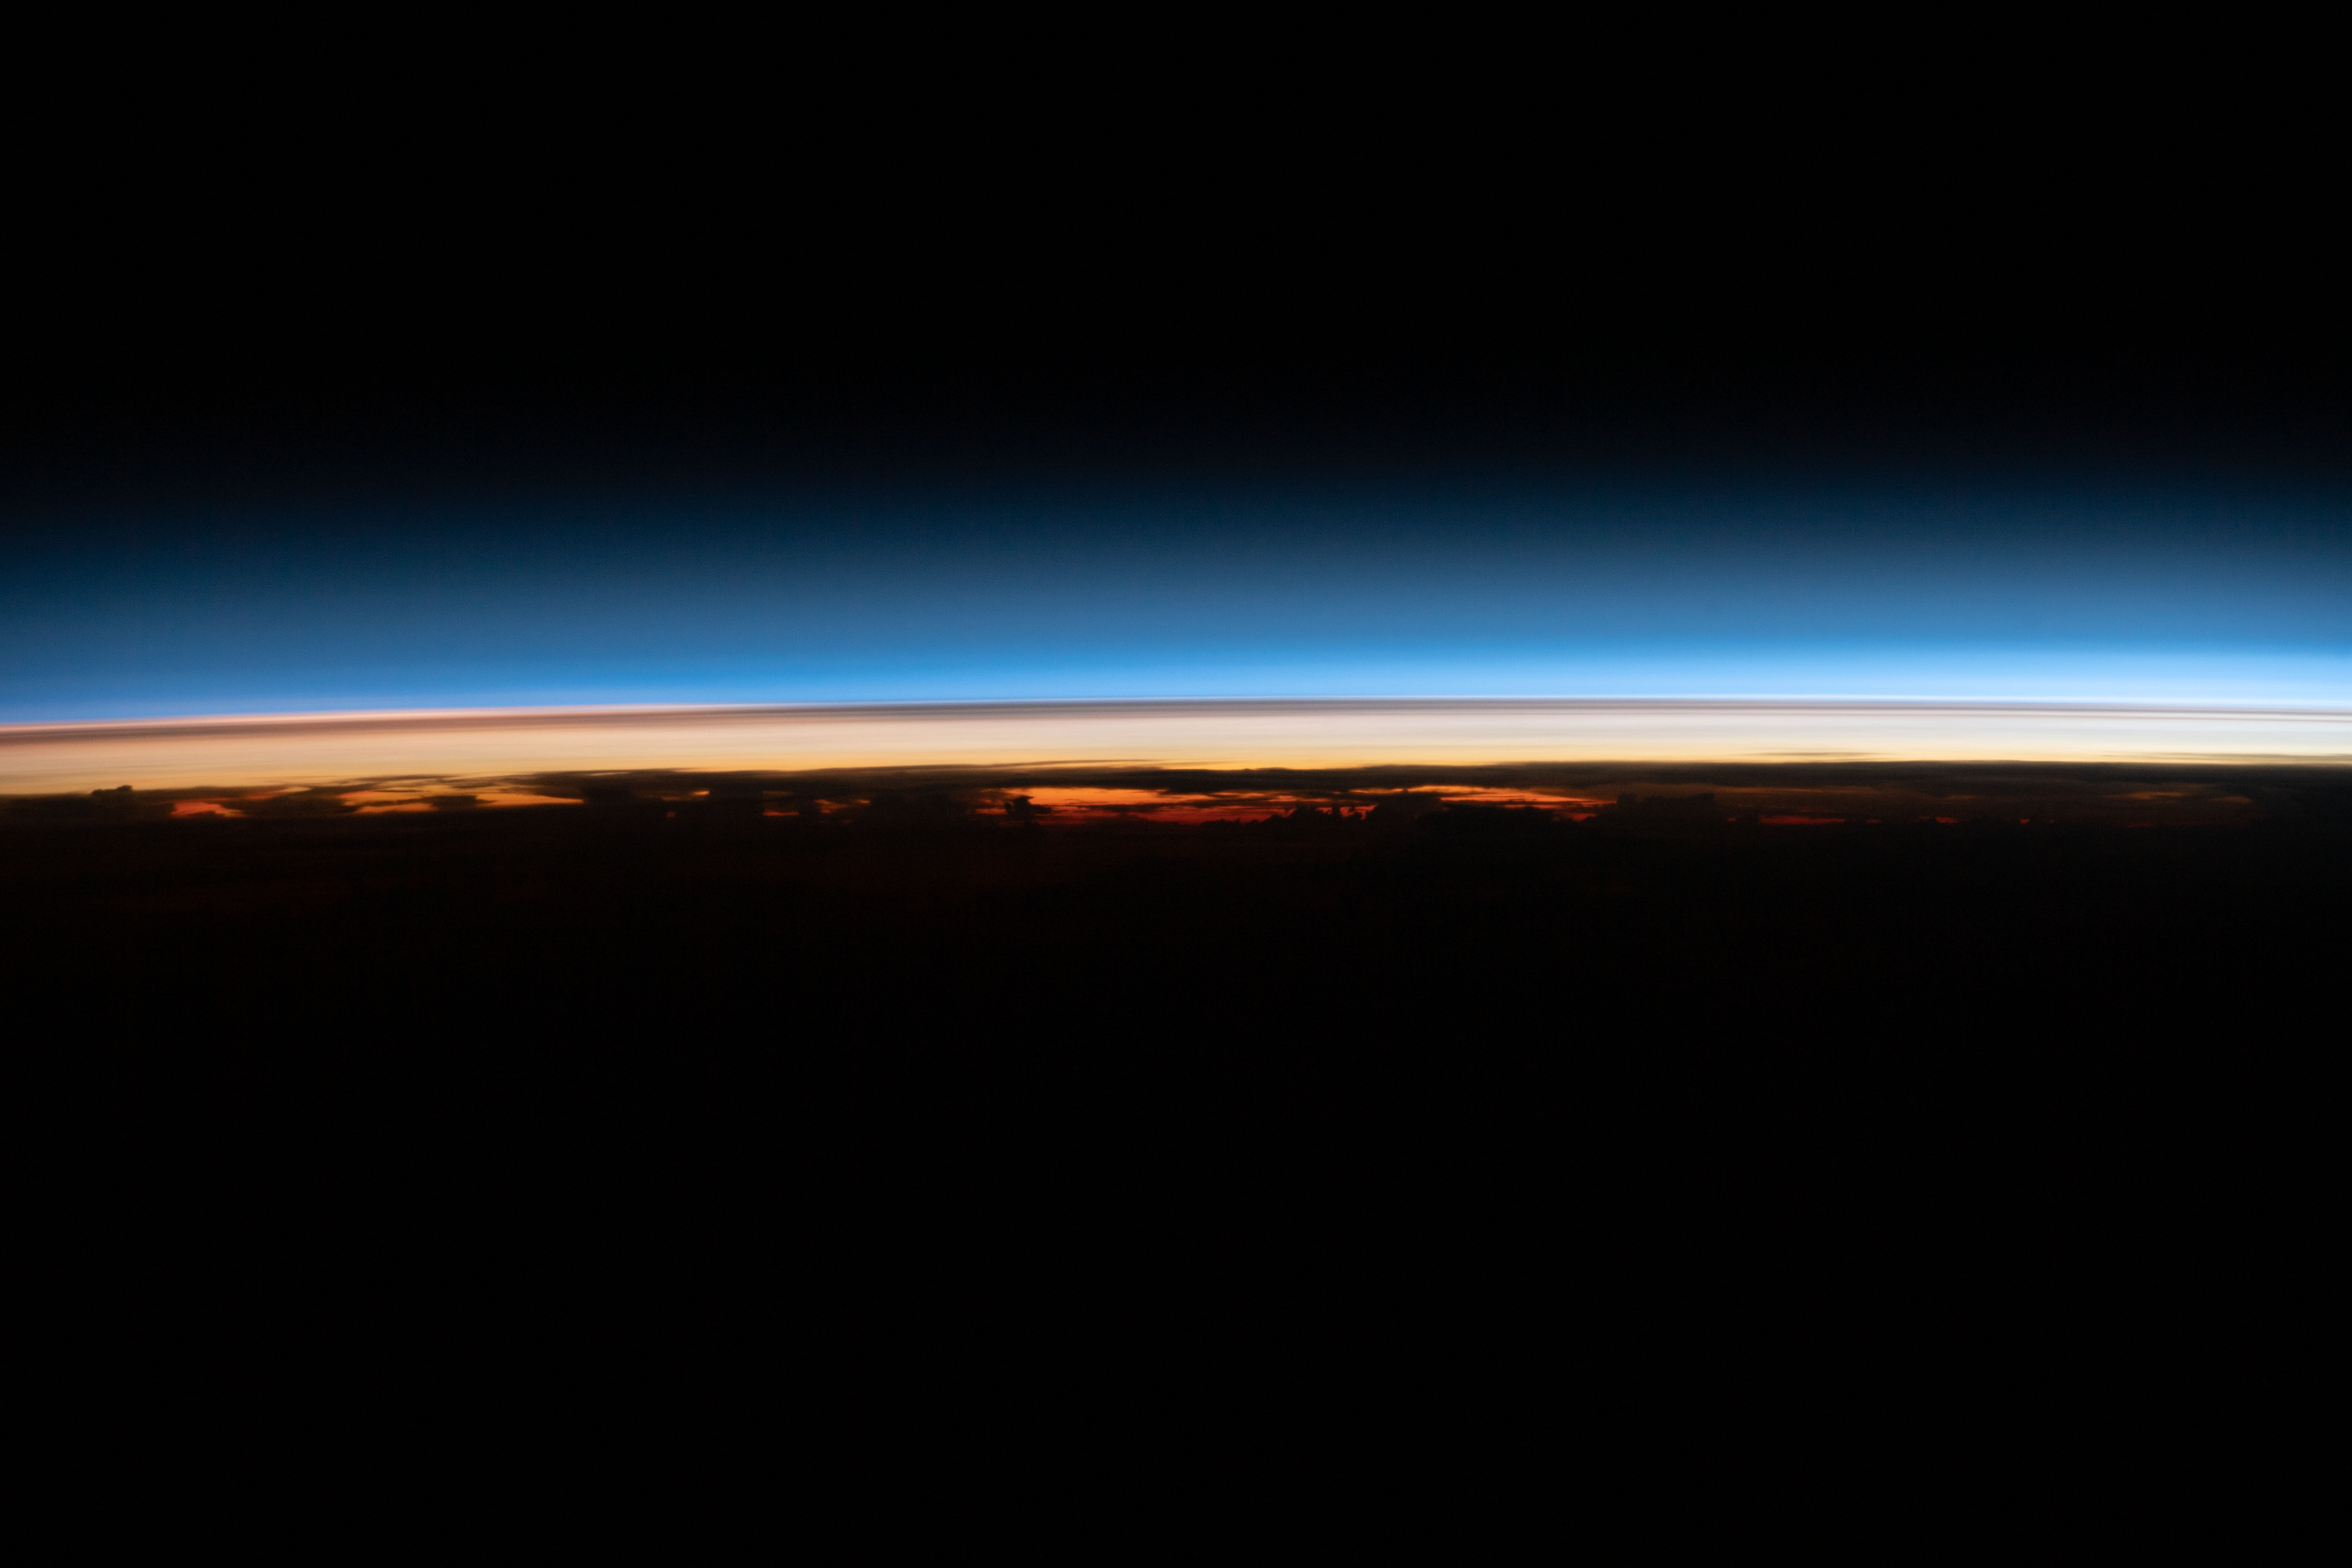
In this photo captured from the ISS in March 2022, the Earth’s limb is shown with a dark thin layer sitting in the bluish color of the stratosphere. This dark thin layer is remnants of the Tonga volcanic plume, lingering in Earth’s stratosphere months after the eruption that occurred in January 2022.
Credits: Image courtesy of the Earth Science and Remote Sensing Unit, NASA Johnson Space Center; Photo number: ISS066-E-161686; https://eol.jsc.nasa.gov; PI: Jean-Paul Vernier, National Institute of Aerospace/NASA Langley Research Center
In July, purple and pink hues painted the Antarctica and New Zealand skies — likely the result of atmospheric particles called aerosols that belched into the stratosphere in January during the eruption of the Hunga Tonga-Hunga Ha’apai volcano. Aerosols from eruptions, and extreme wildfires, can remain in the stratosphere for months to years traveling around the globe, scattering light from the sun, and creating the colorful glow seen this summer in the Antarctic and New Zealand skies.
Stratospheric water vapor also continues to linger at high altitudes around the globe from the Tonga eruption and can remain in the atmosphere for several years.
More importantly, lingering stratospheric aerosols and water vapor can affect Earth’s climate. Not only can increased water vapor lead to the destruction of Earth’s sunscreen, stratospheric ozone, but because it is a greenhouse gas it warms the atmosphere. This offsets the cooling that occurs when stratospheric aerosol particles block sunlight by absorbing or scattering it.
A key part of NASA’s climate observing system, the Stratospheric Aerosol and Gas Experiment (SAGE) III instrument on the International Space Station (ISS) observed dramatically enhanced, very concentrated layers of stratospheric aerosol particles and water vapor as high as 42-44 km in altitude immediately following the Tonga eruption. In subsequent months, SAGE continued to detect enhanced aerosols and water vapor in the Tonga region and around the globe.
“The water vapor enhancements from the Tonga eruption seen by the SAGE III instrument are three to four times those ever recorded by a SAGE instrument, dating back to 1985,” said David Flittner, SAGE III/ISS Project Scientist at NASA’s Langley Research Center in Hampton, Virginia.
Since June 2017, SAGE III has been producing stable, high-resolution measurements of stratospheric aerosols and gases such as ozone and water vapor through solar occultation, a process of observing the Sun rise and set through Earth’s atmosphere.
Scientists rely on the SAGE III dataset as a critical input to the models used to show how volcanic aerosols or smoke from wildfires affect Earth’s climate. To support the climate modeling community’s mission for accurately predicting climate change, the publicly available Global Space-based Stratospheric Aerosol Climatology (GloSSAC) was developed by Larry Thomason, lead scientist for the SAGE III/ISS aerosol extinction coefficient product. It provides a continuous long-term record (currently 1979-2021) of global stratospheric aerosol measurements incorporating observations made by NASA, including the pivotal SAGE series of measurements, and other international space instruments.
“Capturing this stratospheric aerosol data over time is important because aerosols play a major role in determining the radiative and chemical balance of Earth’s atmosphere,” said Mahesh Kovilakam, SAGE III scientist and GloSSAC team member with SSAI, Inc. working at NASA Langley.
Between August 2005 and June 2017 there was not an operational SAGE instrument and the GloSSAC team turned to data from other spaced-based missions, particularly the Canadian Space Agency’s Optical Spectrograph and Infrared Imaging System (OSIRIS) and the NASA-CNES (The National Centre for Space Studies) Cloud-Aerosol Lidar and Infrared Pathfinder Satellite Observation (CALIPSO) instruments. With the availability of SAGE III data in 2017, the team was able to calibrate these less direct measurements for a consistent record of aerosol amount.
SAGE III provides highly reliable measurements of aerosols at multiple wavelengths, which helps NASA scientists understand more about the size of observed aerosols. Understanding aerosol size is important considering the cooling and ozone-destroying effects that some aerosols can have on Earth’s atmosphere over time.
While data from OSIRIS and CALIPSO are crucial to GloSSAC, they are both prone to overstate the amount of aerosols in the atmosphere and are blind to aerosol size. When SAGE measurements were available prior to August 2005 and after June 2017, scientists were clearly able to see sharper signals from eruptions and large fires.
As the SAGE III mission continues, the GloSSAC team is making enhancements to the dataset available to the public.
“After a volcanic eruption such as Tonga, it can be difficult to distinguish between large aerosol particles and clouds in the data, especially in the upper troposphere/lower stratosphere region,” said Kovilakam.
GloSSAC’s most recent version includes an added feature that filters out clouds, which helps refine the data set and provide climate modelers with an even more accurate picture of the impact that volcanic eruptions and extreme wildfires have on Earth’s atmosphere.
“GloSSAC is an extremely valuable resource for scientists studying the stratospheric aerosol layer,” said GloSSAC data user Matthew Toohey, a professor at the University of Saskatchewan. “It’s the gold standard — the obvious choice for quantifying the stratospheric aerosol from volcanic eruptions and wildfires, and for validating new observational data or aerosol model simulations.”